Editor
Anyone is free to use any tool of choice for development. d-centralize follows EditorConfig to define and maintain a somewhat consistent coding style. It is highly recommended to use an editor which supports this. For many editors this is supported through a plugin.
Preferred editors
Section titled “Preferred editors”At d-centralize the following editors are preferred by most of the employees. Pick any of these if you have no strong preference:
- VS Code for regular software development.
- JetBrains for regular software development.
- Vim for quick edits. E.g. making a commit message.
- Meld for resolving merge conflicts.
If you want to use another editor, skip the remainder of this page.
Installing VS Code
Section titled “Installing VS Code”From here you can download VS Code Download
Ubuntu instructions:
curl https://packages.microsoft.com/keys/microsoft.asc | gpg --dearmor > microsoft.gpgsudo install -o root -g root -m 644 microsoft.gpg /etc/apt/trusted.gpg.d/sudo sh -c 'echo "deb [arch=amd64] https://packages.microsoft.com/repos/vscode stable main" > /etc/apt/sources.list.d/vscode.list'sudo apt updatesudo apt install codeVS Code can be used for a lot of languages, however in order to get the best experience with the tool extensions are required. The extensions are be for highlighting, snippets or IntelliSense.
Install some of the curated extensions that can help you.
Debug a React project in VS Code
Section titled “Debug a React project in VS Code”To debug a React project through VS Code, you need to configure a debugger.
- Go to the Run and Debug view (usually part of your VS code
panel/navigation bar) or just use
Ctrl+Shift+Dto go there quicker. - Select option ‘create a launch.json file’, then choose a debugger ‘Web app(Chrome)’ from the dropdown menu
- Change the url key value to match your url (ex:
http://localhost:8000) - (Only required for webpack projects). Add this section to your VS
Code debugger configuration (
launch.jsonfile)
"webRoot": "${workspaceFolder}/src","sourceMaps": true,Debugger is now configured, and you can place your first breakpoint, go and run the new custom configuration.
Installing a JetBrains IDE
Section titled “Installing a JetBrains IDE”JetBrains offers essential tools for software developers. You can download each tool separately here. However, it is recommended to use the JetBrains Toolbox App.
With JetBrains IDEs, knowing how one works, enables you to use all of them, since the user interface is similar (all based on IntelliJ) and the shortcuts are mostly the same. Knowing shortcuts in any IDE is essential, X Key Promoter helps you to learn essential shortcuts while you are working.
JetBrains PyCharm for Python development
Section titled “JetBrains PyCharm for Python development”This Python IDE offers all the tools you need in one place.
JetBrains WebStorm for JavaScript development
Section titled “JetBrains WebStorm for JavaScript development”This JavaScript IDE offers all the tools you need in one place.
Installing Vim
Section titled “Installing Vim”The following installs Vim in Ubuntu with some recommended plugins:
sudo apt-get install vimmkdir -p ~/.vim/autoload ~/.vim/bundlecurl -LSso ~/.vim/autoload/pathogen.vim https://tpo.pe/pathogen.vimecho 'execute pathogen#infect()' >> ~/.vimrccd ~/.vim/bundlegit clone https://github.com/editorconfig/editorconfig-vim.gitgit clone https://github.com/scrooloose/syntastic.gitSpellchecking
Section titled “Spellchecking”Let Vim spellcheck both Dutch and English at the same time by adding
this configuration to ~/.vimrc:
autocmd Filetype rst setlocal spell spelllang=en,nlSome handy commands to remember:
z= Suggest alternatives for the word
zg Add word to dictionary
zw Remove word from dictionary
You can carry around your personal additions to the word lists in
~/.vim/spell/en.utf-8.add.
Installing Meld
Section titled “Installing Meld”The following installs Meld in Ubuntu:
sudo apt-get install meldTests and debugging
Section titled “Tests and debugging”PyCharm(Python)
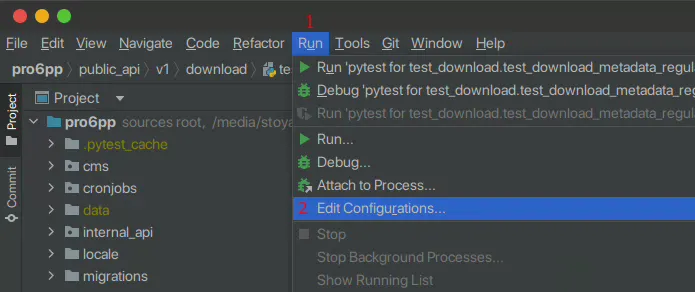
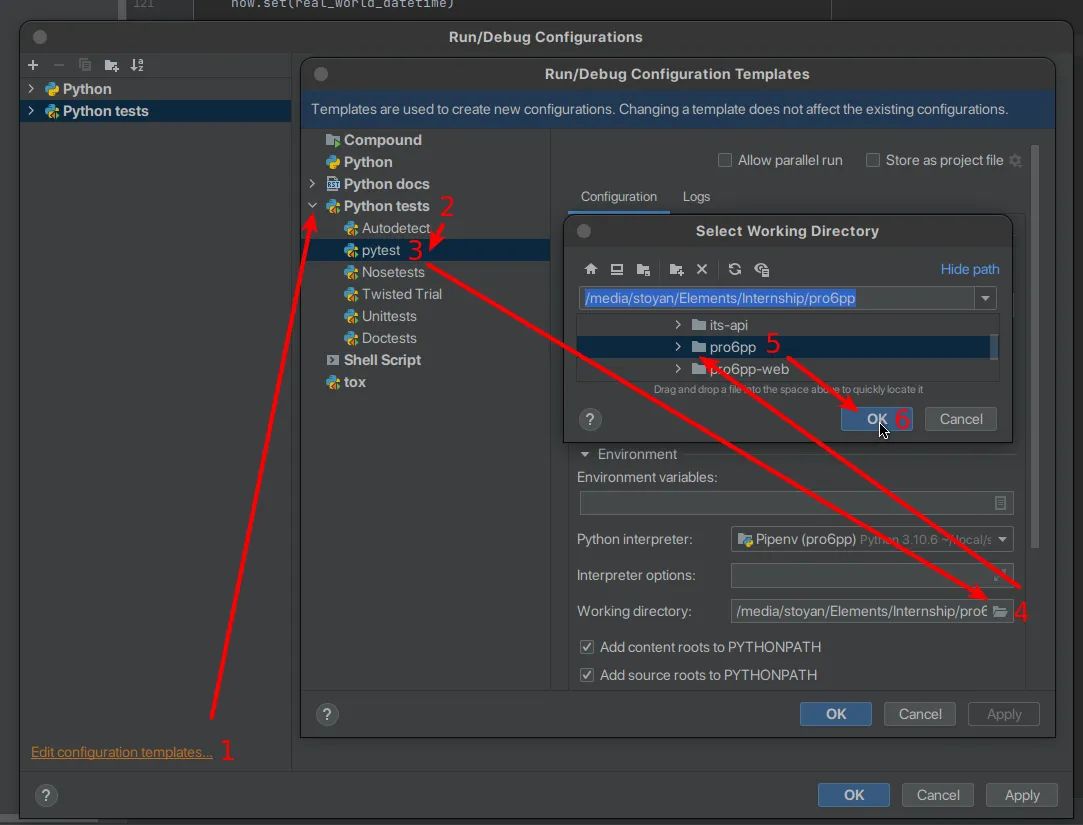
Section titled “PyCharm(Python)”Before being able to run the tests, the working directory has to be
set. Go to Run -> Edit configurations...
Go to Edit configuration templates.. -> Python tests -> pytest
and change the Working directory: to the root folder - pro6pp in our
case:
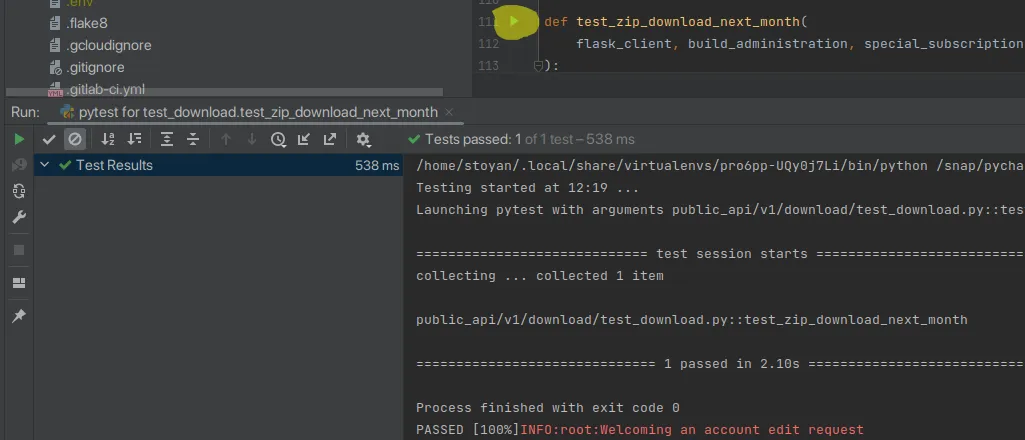
That’s it. Tests can now be run using the play button next to their definition:
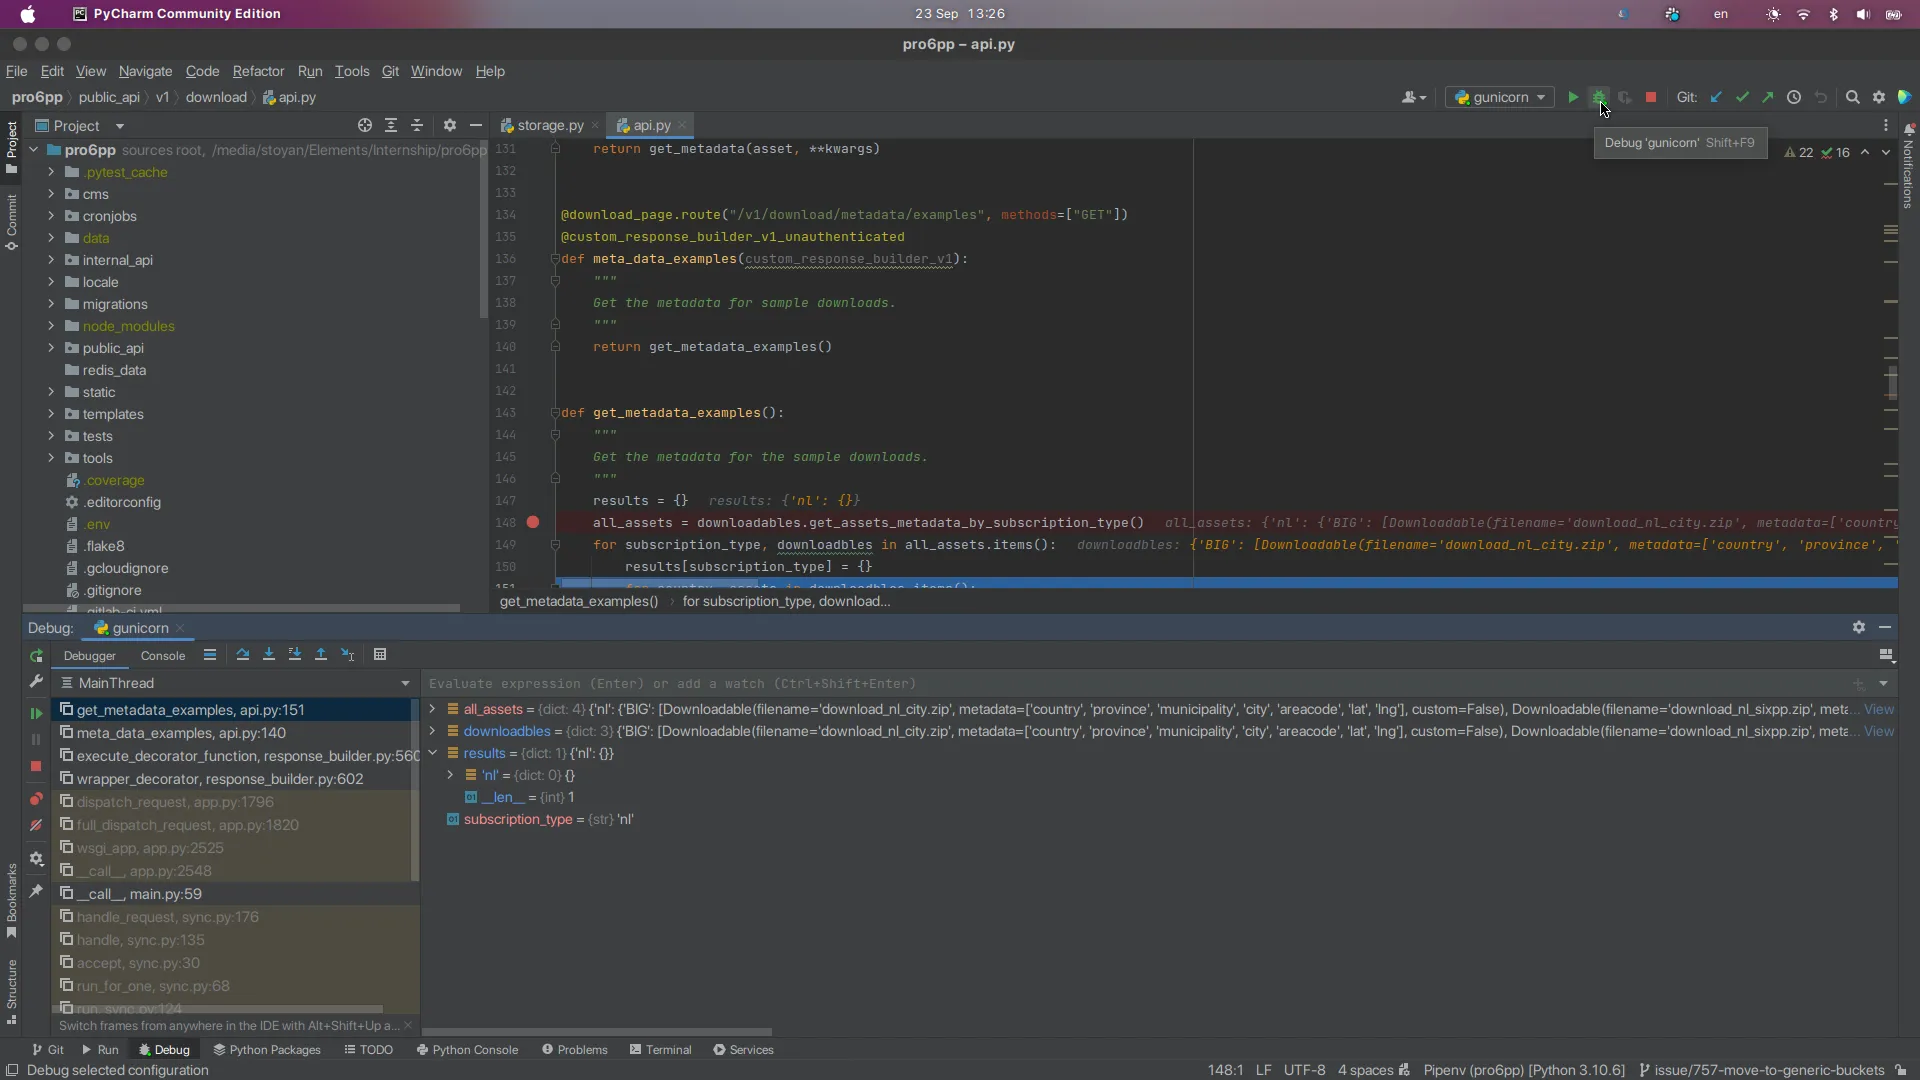
Debugging
Section titled “Debugging”In order to set up debugging, first go to Run ->
Edit configurations:
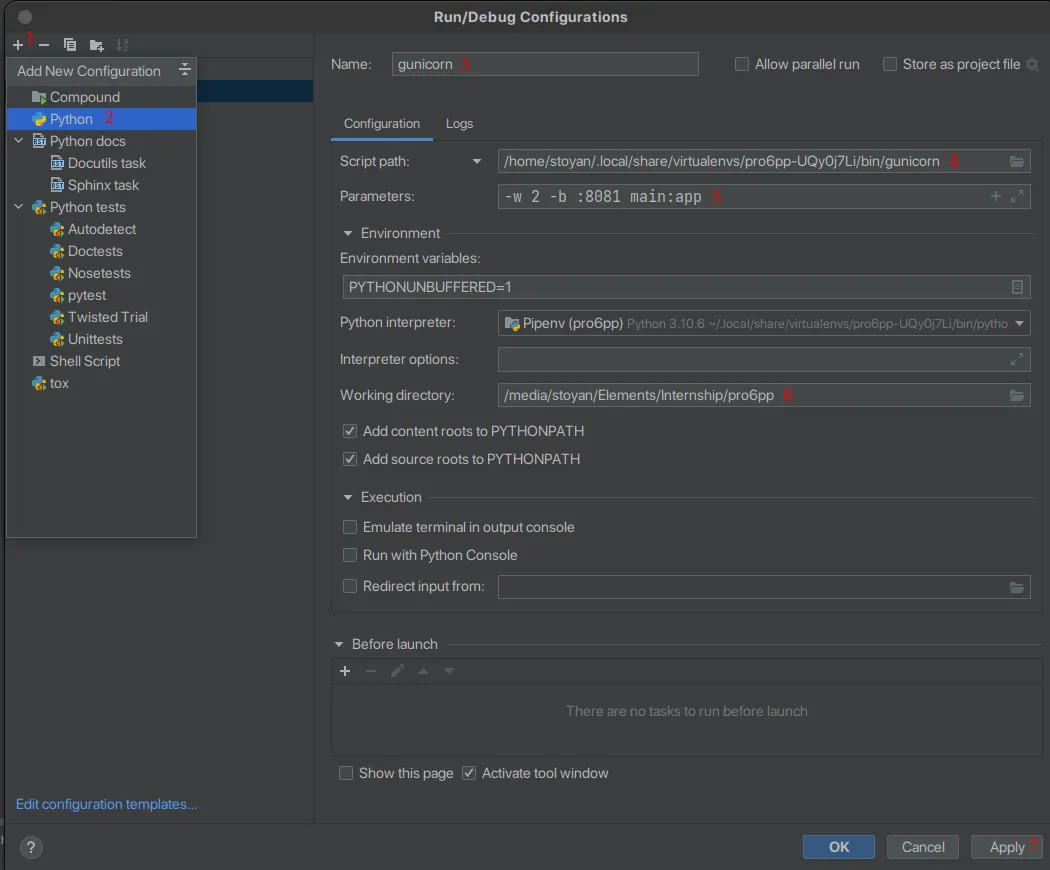
As shown below, add(1) a new Python configuration(2), give it a name
that you like(3), define the Script path: to the gunicorn
executable(4) that is usually stored as
/home/<your username>/ .local/share/virtualenvs/<your-virtualenv>/bin/gunicorn.
Provide the running Parameters:(5) and set the Working directory: as
the root folder of the project - in our case pro6pp. Finally, apply
all changes(7):
Everything is now set. Set a breakpoint and start debugging: